Data Science and Visualization
We help disparate communities to adapt innovative visual analysis and data science tools to their needs.
SuAVE: Survey Analysis via Visual Exploration
SuAVE is an online platform for visual exploratory analysis of surveys and image collections. It integrates visual, statistical and cartographic analyses and lets users annotate and share images and distribution patterns. It also provides a gateway into advanced data science and machine learning tools by integrating with R and Jupyter notebooks. We collaborate with UC San Diego researchers on bringing SuAVE to local and global communities.
See San Diego Supercomputer Center SuAVE site for more details.
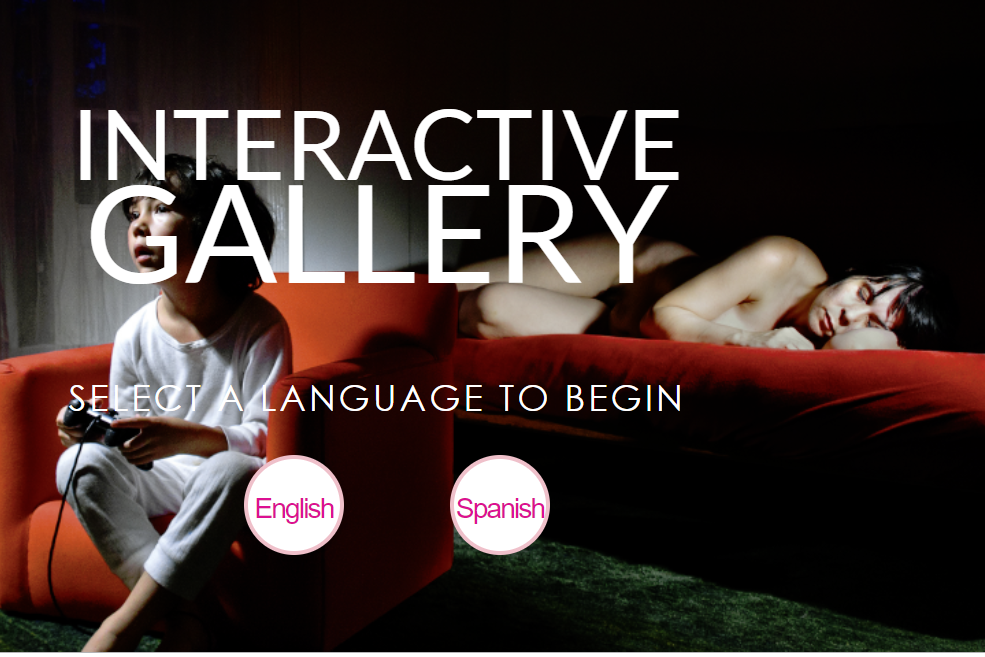
We used SuAVE to create online presence of the "Point/Counterpoint" -- Contemporary Mexican Photography exhibition at San Diego Museum of Photographic Arts
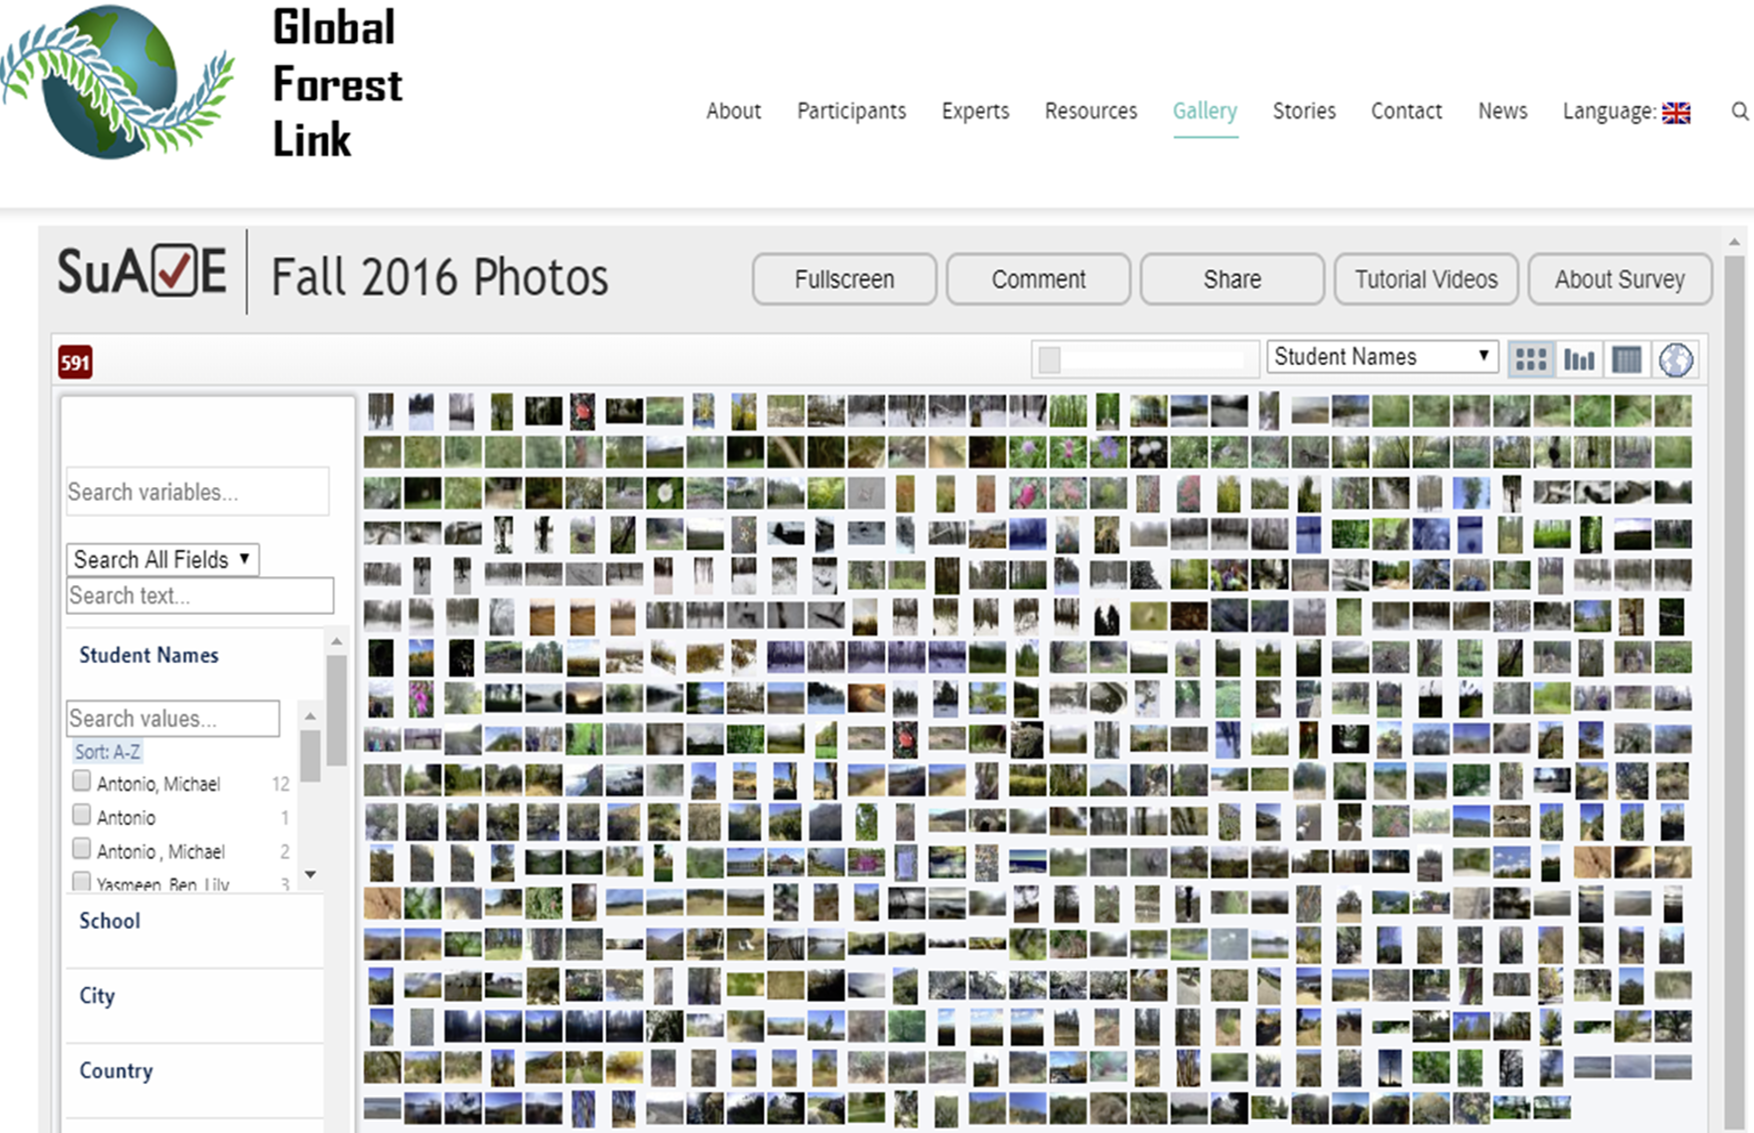
We used SuAVE to share and analyze georeferenced forest images and viceos collected by the Global Forest Link -- International Environmental Education Program -- participants
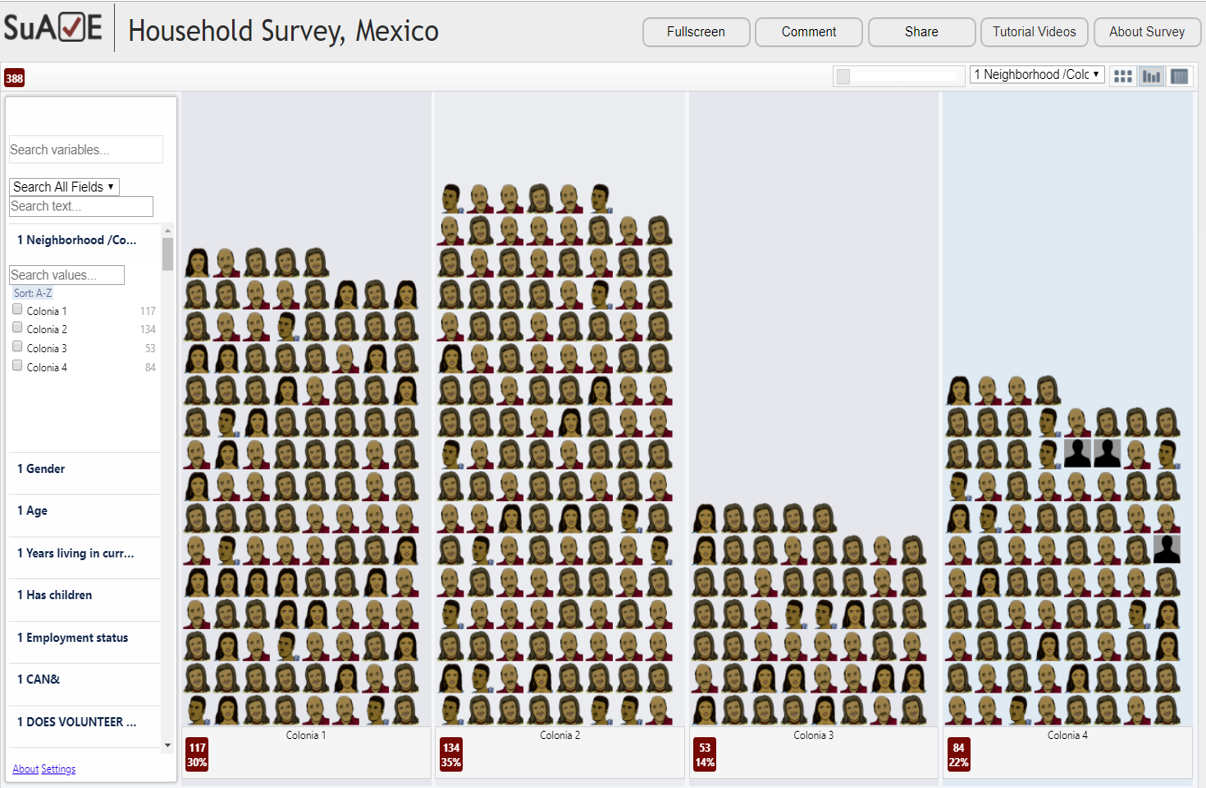
We used SuAVE to publish, share and analyze questionnaire surveys of participants and stakeholders administered for benchmarking and evaluation of our numerous projects and education workshops.